
Understanding Regional and Site-specific Earthquake Impact Data: Different Tools for Different Use Cases
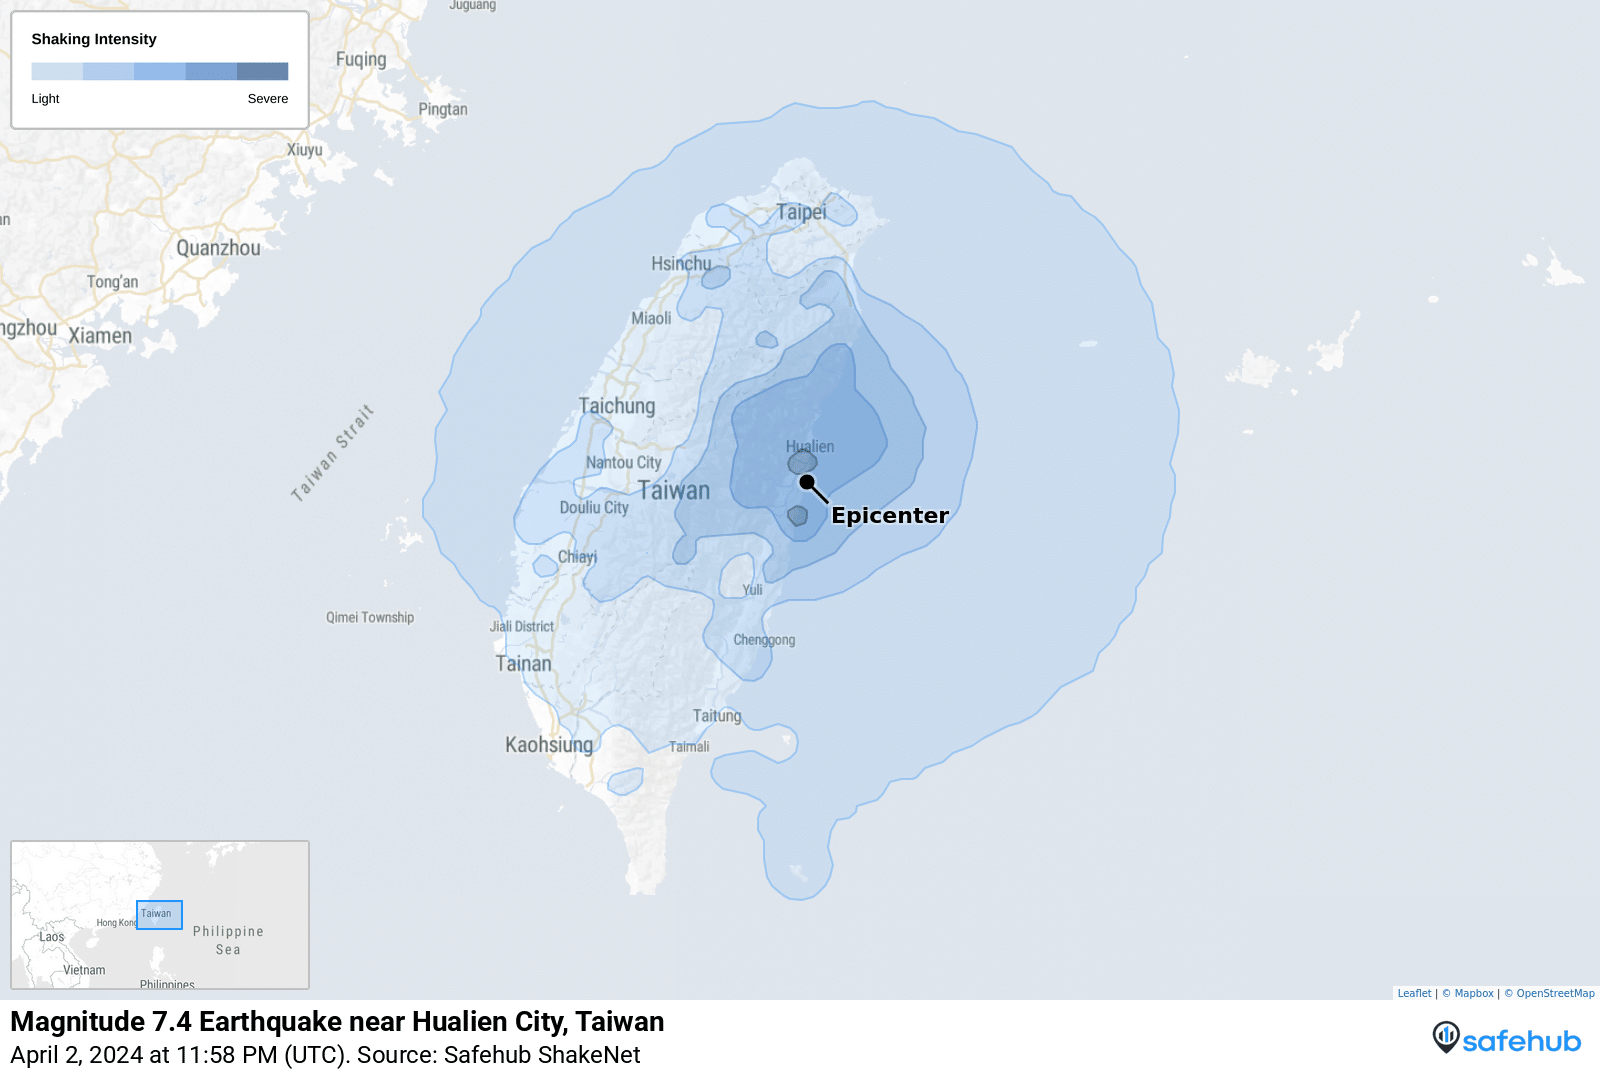
Understanding Regional Shaking Maps
Regional earthquake shaking maps are ubiquitous for a reason: they provide timely visualizations of earthquake shaking at the regional level minutes after an earthquake. These regional maps provide important big-picture information about the scope and severity of earthquake shaking impacts. They are particularly helpful in informing emergency response efforts by highlighting areas of higher vs lower shaking, which can be used as proxies for damage severity.
Regional shaking maps, such as the USGS ShakeMap and the Safehub Shake Network, estimate surface shaking using Ground Motion Prediction Equations (GMPEs). These mathematical relationships model how seismic waves travel through rock, soil, and surface layers based on fault parameters deep within the earth. Because sensors cannot be placed everywhere, GMPEs provide the essential framework for estimating shaking across an entire region.
To calculate these complex hazards and risks globally, Safehub’s Shake Network is powered by the OpenQuake engine, an industry-standard open-source automation platform developed by the Global Earthquake Model (GEM) Foundation.
Constraining the Models with Ground-Truth Data
To maximize accuracy, these mathematical estimates must be anchored—or “constrained”—by real-world data. This is achieved through three primary data streams:
- Public Seismic Networks: High-precision, scientific-grade data from government-backed and publicly available earthquake sensors.
- Proprietary IoT Networks: Dense configurations of low-cost, easy-to-install sensors (such as those deployed by Safehub) that fill critical gaps in areas lacking public infrastructure.
- Crowdsourced Reports: Citizen-science contributions, such as the USGS Did You Feel It? (DYFI) questionnaire, which translate subjective human experiences into quantifiable shaking intensity levels.
Network Architecture and Granularity
The overall granularity and precision of any individual shaking map depend heavily on how its underlying GMPEs are constrained. While both the USGS ShakeMap and the Safehub Shake Network utilize publicly available sensor data, their secondary optimization methods differ:
- USGS ShakeMap integrates public sensors with widespread, crowdsourced DYFI responses.
- Safehub Shake Network pairs public sensors with its own dense, proprietary IoT sensor networks.
The Need for Site-Specific Shaking Data
Complementing this big-picture view, site-specific shaking measurements provide critical infrastructure operators with information on what happened at a specific building, substation, hospital, school, or data center, etc. Operators can then make data-driven decisions on whether to inspect, shut down, evacuate, or continue operating individual assets.
Safehub makes asset-specific shaking information an attainable reality by installing low-cost wireless seismic instruments directly at facilities, giving operators site-specific earthquake shaking data they need. Rather than estimating shaking at an individual asset by depending on the regional maps described above, Safehub sensors allow clients to measure the actual shaking their facility experienced. For infrastructure operators with too-important-to fail assets (electrical substations, transit hubs, emergency operations centers, schools, etc.), this site-specific approach provides a critical level of actionable detail that regional maps aren’t designed to deliver.
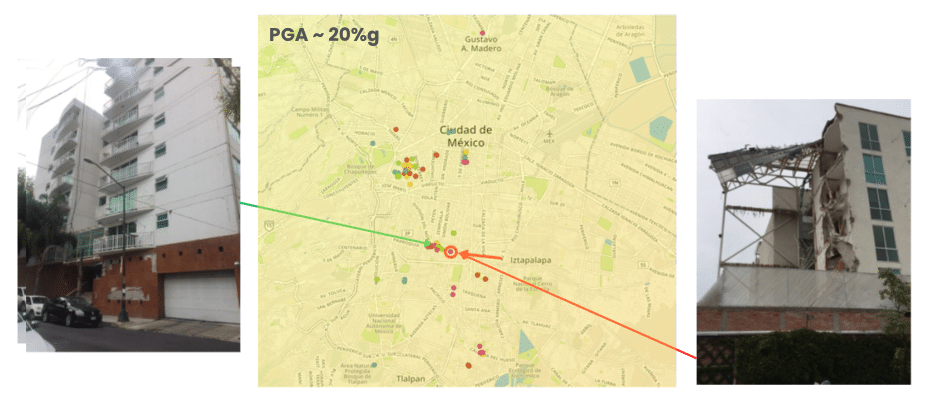
The images below show two similar buildings (same type and date of construction) located across the street from one another that were impacted by the same earthquake in Mexico in 2017. Although regional shaking maps placed both buildings within the same shaking-intensity contour, the actual shaking they experienced, and resulting damage, differed significantly. Sensors in the buildings would have provided a clearer picture about the level of shaking that each building experienced.
This site-specific information can also save people time, money, and unnecessary suffering:
- Get critical help to the people who truly need it – don’t waste limited disaster response resources deploying help where it’s not needed
- Reduce downtime and eliminate unnecessary facility shutdowns: many organizations “err on the side of caution” and shut everything down, even for low shaking levels that didn’t come close to causing damage. This is quite common, and quite costly.
- Gain clarity in real time with high-level damage severity information as well as detailed engineering data – save time and money by only sending inspectors to where their expertise can make a difference. Read how a Safehub subscription paid for itself after a moderate earthquake impacted client assets: NSEM Case Study
Regional vs. Site-Specific Shaking Data: Which Is Right for Your Application?
Below is a side by side comparison of when to use each solution and how the two scales of information can complement each other.
| Question | Regional Shaking Data | Safehub At-Location Instrumentation |
| Best for | Regional shaking visualization | Site-specific facility response |
| Data source | Public seismic and Safehub sensor networks, Did You Feel It? (DYFI) human surveys, Ground Motion Prediction Equations (GMPEs) | Seismic instruments installed at customer assets |
| Resolution | Regional / interpolated | Building or asset level |
| Timing | Varies | Near-real-time / operational alerting |
| Use case | Public awareness, emergency response overview, regional-level parametric insurance | Facility triage, inspection prioritization, business continuity, asset-level parametric insurance |
| Limitation | Not intended for specific buildings | Requires sensor deployment at-location |
For organizations seeking a general understanding of earthquake shaking across a region, regional shaking data is most appropriate. For those whose operations, revenue, and recovery timelines depend on the performance of specific physical assets, site-specific shaking data provides a critical advantage. Safehub’s earthquake sensors deliver precise, building-level insights that help organizations reduce unnecessary downtime, prioritize inspections, and accelerate recovery.